
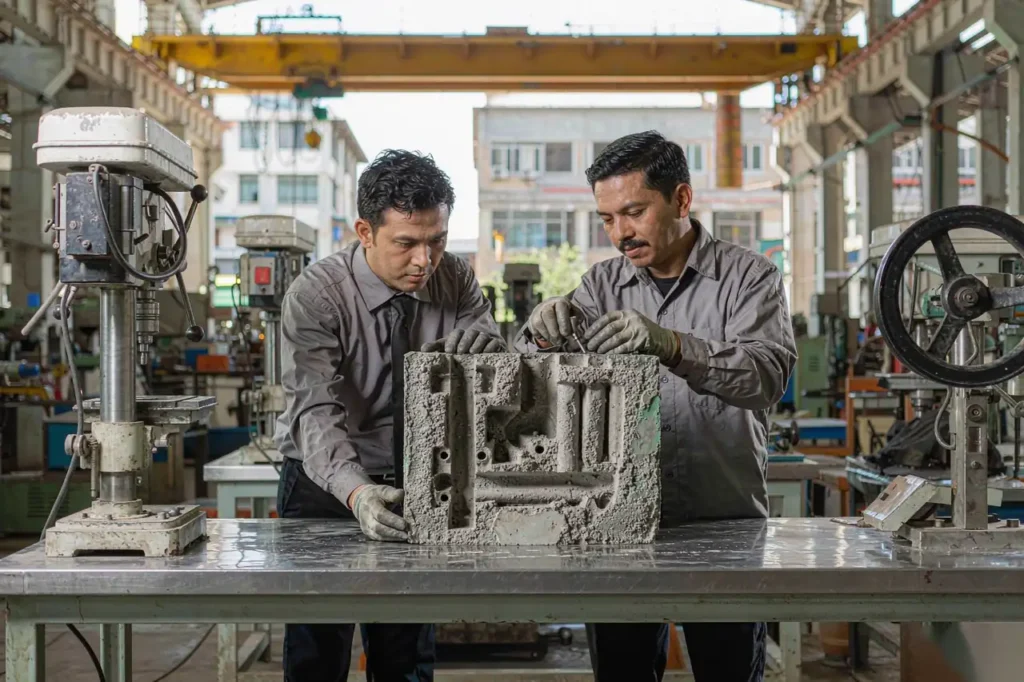
Casting simulation shows you where a part will shrink, misrun or trap air before a single tool is cut. For a buyer who has already paid for a pattern, that difference is measured in weeks of delay and four-figure rework bills, not in software licences.
This article is written for engineers and sourcing teams who are deciding whether to pay for a solidification study before tooling. It covers what a casting simulation actually solves, the mesh and boundary-condition numbers that decide whether a result is trustworthy, the four criteria worth reading in a report, and the break-even arithmetic that tells you when the study pays for itself. Where a number matters, it is given with the standard or the formula behind it — including AFS guidance on feeding and NADCA practice for high-pressure processes.

What Casting Simulation Solves Before Steel Is Cut
A casting simulation is a numerical solve of two coupled problems: how molten metal fills the cavity, and how that metal then cools and freezes. The solver meshes the casting, the gating system, the risers, the cores and a shell of mold material, then steps through time — typically milliseconds during filling, seconds during solidification — and records what happens at every cell.
Filling is a free-surface flow problem: mass, momentum and energy, with the metal front tracked across the mesh. Solidification is heat conduction with latent heat released over the freezing range of the alloy. Some packages add a third stage for residual stress and distortion, using the temperature history as the load case.
What you get out of a casting simulation is not a picture. It is a set of decision inputs:
| Output | What it flags | What you change |
|---|---|---|
| Fill time and front temperature | Misruns, cold shuts, cold laps in thin ribs | Ingate size, pouring temperature, venting |
| Gate velocity and air entrapment | Oxide films, bubble trails, reoxidation defects | Choke area, bottom-fill vs top-fill, filters |
| Hot spot and solid fraction maps | Isolated liquid pools that will not feed | Riser size and position, chills, section design |
| Niyama and porosity criteria | Microporosity invisible until machining | Feeding paths, local chilling, alloy choice |
| Stress and distortion | Camber, hot tearing, dimensional drift | Pre-camber in the pattern, rib layout, shakeout time |
Two of these outputs are the ones that move money: whether the riser actually feeds the section it is supposed to, and whether shrinkage voids will land inside a machined face. Both are questions about solidification order, and both are answerable before tooling exists.
Mesh, Boundary Conditions and Run Time: What Goes Into a Casting Simulation
Most bad casting simulation studies fail on inputs, not on physics. Three settings decide whether a result is worth reading.
Cell size: four to six cells across the thinnest wall
A 300 mm housing with 8 mm walls runs fine at 1.5–2 mm cells, which puts the model at roughly 3–6 million cells. A thin-wall aluminium part with 3 mm walls needs about 0.6–0.8 mm cells, and the same physical volume then jumps to 15–20 million cells. Below four cells through a wall, flow separation and feeding gradients get smeared out and the hot spot moves to the wrong place.
Run time follows cell count and time-step count: 2–12 hours on 8–32 cores for a 5 million cell model, overnight to 30 hours for a 20 million cell thin-wall model. Budget the calendar, not just the compute — meshing and cleanup typically take longer than the solve.
Heat transfer coefficients: the number everyone guesses
The interface between metal and mold governs solidification time, and it is the value most often copied from a default library. As the casting freezes and pulls away, an air gap opens and the coefficient drops sharply.
| Interface | Typical HTC (W/m²·K) | Note |
|---|---|---|
| Sand mold, early | 800–1,800 | Before the air gap forms |
| Sand mold, after gap | 300–600 | Dominates most of solidification |
| Permanent mold / coated die steel | 2,000–6,000 | Coating thickness matters |
| High-pressure die casting | 5,000–15,000 | Fill in 30–100 ms, not seconds |
| External chill | 4,000–10,000 | Steel or graphite, contact-dependent |
| Insulating sleeve | 100–300 | Extends riser feeding time |
Getting this wrong is not cosmetic, and it is the most common reason a casting simulation disagrees with the first trial. A 30% error in the effective interface coefficient shifts predicted solidification time by roughly 15–25%, which is more than enough to move a hot spot from a riser neck into the casting.
Pouring and mold initial temperatures
Use the shop’s real window, not a textbook value: gray iron 1,380–1,450 °C, ductile iron 1,400–1,460 °C, carbon steel 1,560–1,620 °C, A356 aluminium 700–750 °C. Sand molds usually start at 20–40 °C; a production metal mold runs 200–350 °C and a die 180–250 °C. If the foundry pours from a 2-tonne ladle over 90 seconds, the metal arriving last is cooler than the metal arriving first — that belongs in the model too.
Four Criteria Worth Reading in a Casting Simulation Report
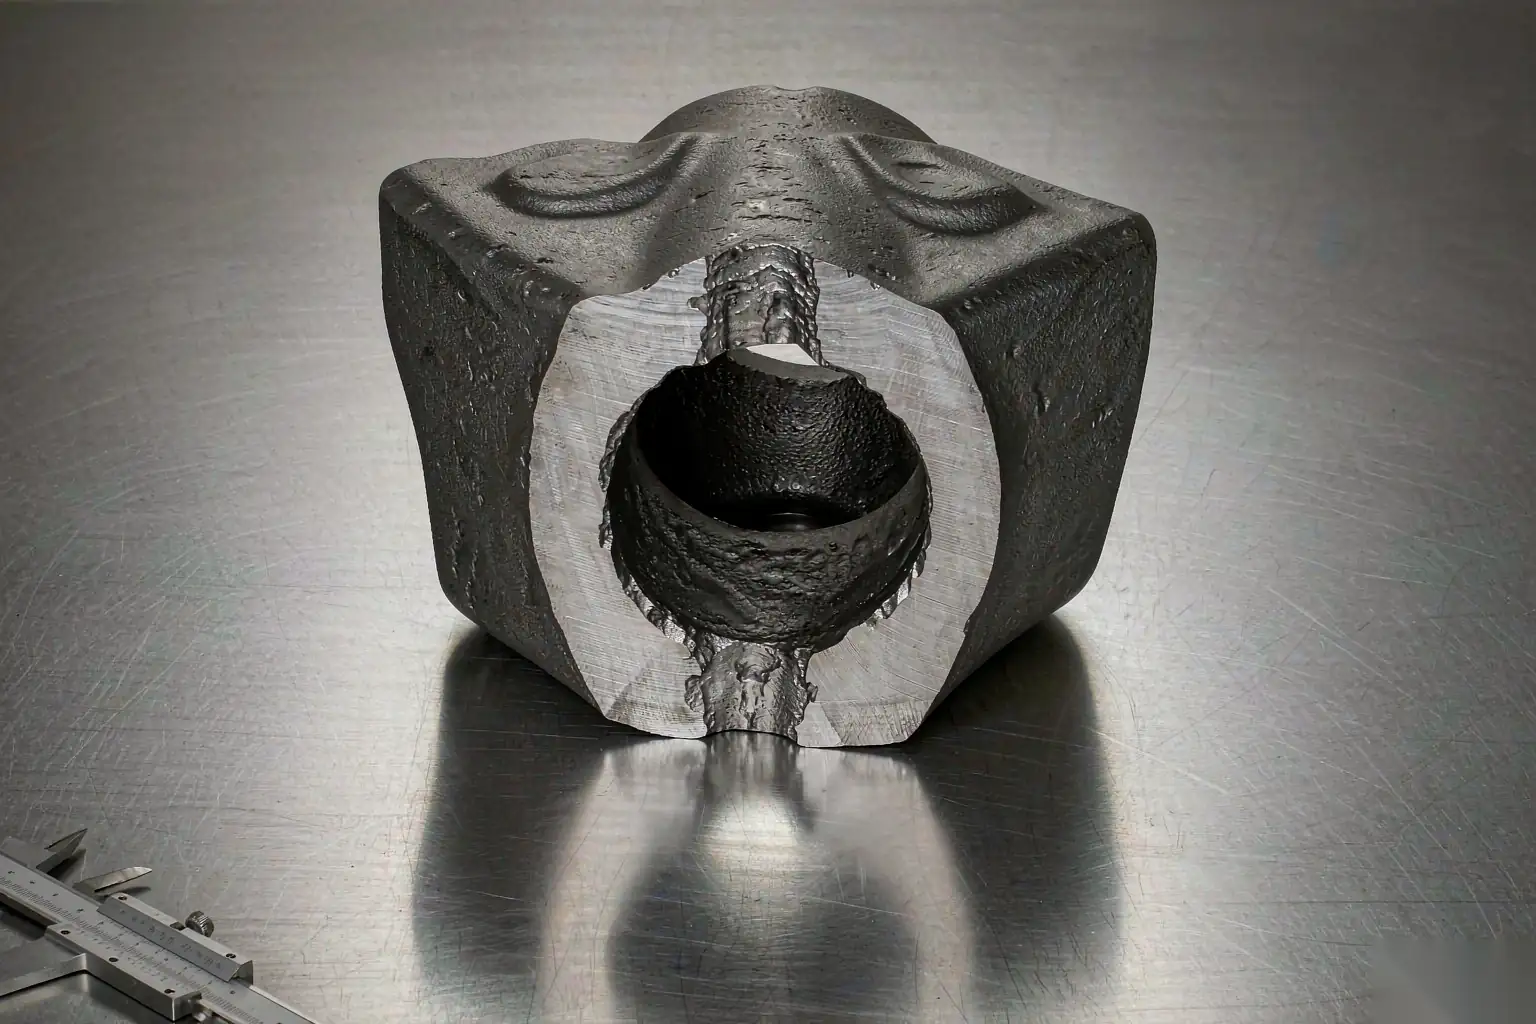
A report can be 60 pages and still tell you nothing. These four numbers carry most of the decision in any casting simulation, and each one has a threshold you can check yourself.
1. Fill time and gate velocity
Worked example, A356 housing: cast weight 6.4 kg, gating and risers add 2.1 kg, total poured metal 8.5 kg. Liquid aluminium at temperature is about 2.40 g/cm³, so the poured volume is 8.5 / 2.40 = 3.54 litres. For a 4 mm wall section the safe fill time is around 9 s, which needs a flow rate of 3.54 / 9 = 0.394 L/s = 3.94 × 10⁻⁴ m³/s. Holding the gate velocity at the 0.5 m/s surface-turbulence ceiling for aluminium gives a total choke area of 3.94 × 10⁻⁴ / 0.5 = 7.9 cm² — four ingates of about 2 cm² each.
Reynolds number is not the useful check here. At 0.5 m/s through a 20 mm runner, liquid aluminium gives Re ≈ 18,000 — nominally turbulent, and almost every real gating system is. The criterion that correlates with oxide entrainment is critical inlet velocity, roughly 0.4–0.6 m/s for aluminium and around 1.0 m/s for ferrous alloys; above it, the front breaks up and folds air and oxide into the metal. That is the same mechanism discussed in sand casting flow turbulence control.
2. Solidification time and modulus
Chvorinov’s rule still governs the sanity check on any casting simulation: t = (M / K)², with modulus M = volume / cooling surface area and K a mold-and-alloy constant. A 20 mm aluminium plate has M = 1.0 cm. In sand, K ≈ 1.8 cm/min0.5 gives t = (1.0 / 1.8)² = 0.309 min ≈ 18.5 s. The same plate in a coated permanent mold, K ≈ 3.2 cm/min0.5, gives t = (1.0 / 3.2)² = 0.098 min ≈ 5.9 s.
Three times faster freezing is why a metal mold gives a finer structure and tighter dimensional control — and also why feeding distance shrinks and chills become necessary. If your report shows section modulus values but no comparison against riser modulus, it has not answered the feeding question. The practical rule is riser modulus ≥ 1.2 × casting modulus at the fed section.
3. Niyama and the feeding path
Niyama, the criterion most casting simulation packages plot by default, combines thermal gradient G (K/mm) and cooling rate Ṫ (K/s) into Ny = G / √Ṫ. It is a screening tool for microporosity that radiography will not see until the part is nearly finished. Take a low-alloy steel node with G = 1.5 K/mm and Ṫ = 2.5 K/s: Ny = 1.5 / 1.58 = 0.95, sitting right at the level where carbon and low-alloy steels start showing radiographic microporosity (roughly Ny < 1 in K0.5·s0.5/mm). Aluminium-silicon alloys sit an order of magnitude lower, so never carry a steel threshold across to an aluminium part.
The second half of the check is geometric: is there an open liquid path from the hot spot back to the riser, or has a thin section frozen shut and isolated it? A fine Niyama map with a closed feeding path still means shrinkage. This is the same failure mode covered in sand casting porosity and shrinkage.
4. Air entrapment, mold erosion and distortion
Most casting simulation packages report both entrapment and oxide tracking, which show where bifilms will end up — usually at the last point to fill and at corners where two fronts meet. Mold erosion indices flag ingates aimed straight at a sand wall, which is a classic sand-inclusion source. On the stress side, a 1.2 m steel beam predicted at +3.4 mm of camber and measured at +3.0 mm is a good result: the foundry pre-cambers the pattern by −3 mm and the machined part comes out flat. Trust the trend, verify the magnitude with one casting.
Where Casting Simulation Pays Back — and Where It Does Not
The economics of casting simulation are simple once you price the alternative. The alternative is a tooling loop: modify or rebuild the pattern, re-cut core boxes, run another trial, wait again.
| Item | Typical figure |
|---|---|
| Casting simulation study, one part | $600–$2,500, 2–5 working days |
| Internal review and design change | 4–8 engineer hours |
| Pattern modification, one iteration | $1,500–$8,000 |
| New core box, one iteration | $5,000–$20,000 |
| Trial cycle time (tooling + sample + inspection) | 3–6 weeks each |
| Scrap on a new heavy-section steel part | 20–30% first trials, 5–8% after study |
Put numbers on one job. A study costs $1,600 plus 6 hours of engineering at $70/hour, so $2,020 all in. One avoided pattern rework is worth $4,500 plus four weeks. The study pays for itself if the probability of needing at least one rework is above 2,020 / 4,500 ≈ 45% — and on a new steel or heavy-section ductile iron part, that probability is far higher than 45%.
The recurring side is stronger. At 1,800 parts per year with a part cost of $210, cutting shrinkage scrap from 7% to 3% saves 72 parts, or $15,120 per year against a one-off $2,020 — payback inside two months of production.
The same arithmetic is why the study is standard practice on a new steel casting or iron casting programme, and worth requesting before a Sandguss pattern or an Feinguss tool is committed. Where the part goes straight into finish machining, it also protects the CNC-Bearbeitung schedule: a shrinkage void discovered at the machine costs several times what it costs at shakeout.
It does not pay back everywhere. Skip the study when tooling is under about $3,000, the part is a repeat of something already running successfully, wall sections are uniform and generous, or you need one or two pieces. In those cases a prototype casting or a printed pattern run answers the question faster and cheaper. The trade-off is laid out in more detail in what drives casting cost.
What to Send Your Foundry for a Useful Casting Simulation
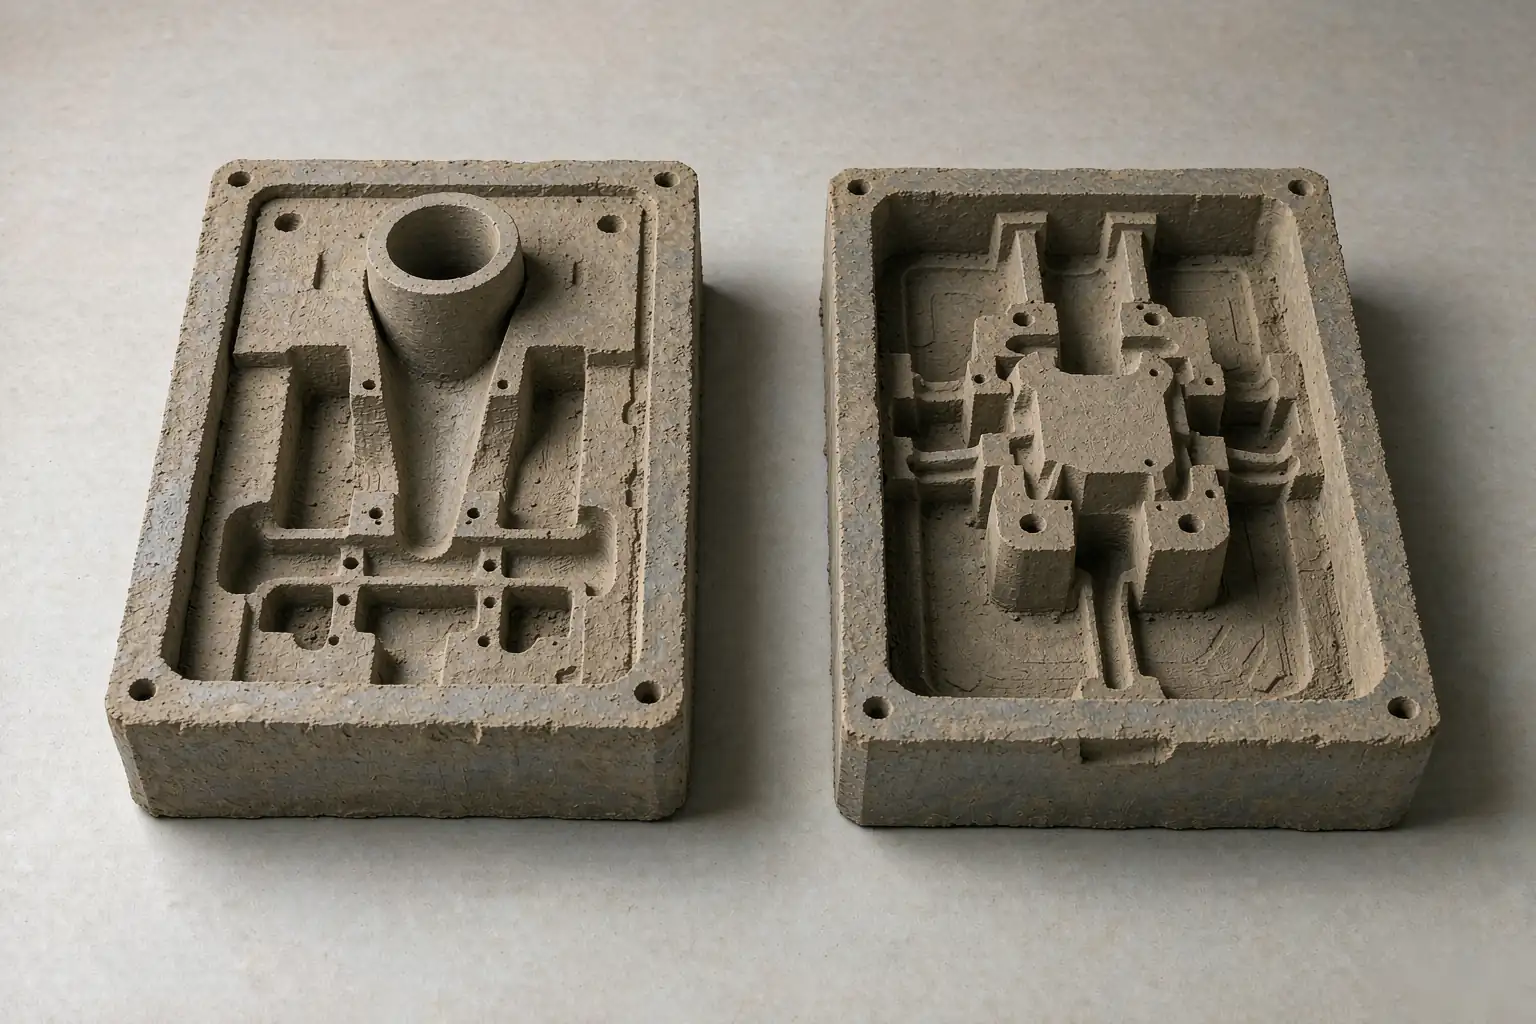
Half the delay in getting a casting simulation done is waiting for inputs. Send this in one package and you get a result on the first pass.
| Input | Why the model needs it |
|---|---|
| 3D model, STEP or Parasolid, as-cast geometry | Machined geometry alone hides the real modulus |
| Alloy and specification (ASTM / EN / ISO grade) | Freezing range drives the whole solidification solve |
| Pouring temperature and ladle practice | Superheat sets fill length and hot spot severity |
| Mold and core process, including coatings | Sets heat extraction and gas load |
| Proposed gating and riser layout, or freedom to design it | Feeding is a system, not a part property |
| Annual volume and batch size | Decides whether tooling is worth optimising |
| Acceptance criteria (RT class, pressure test, leak rate) | Sets the porosity threshold the study is judged against |
| Machined surfaces, datums and critical walls | Defects only matter where they get machined into |
Acceptance criteria deserve a sentence of their own. “No shrinkage” is not a specification. Written against an inspection method it becomes testable: radiography to ASTM E446 category and severity limits on defined zones, plus a pressure hold on the machined part. A simulation that predicts a Niyama value can then be checked against that standard instead of against opinion. One more input is worth agreeing up front: whether the gating layout is fixed by the tooling already built, because a change here usually means a change on the pattern and mold-making side as well.
What Casting Simulation Cannot Tell You
Being clear about the limits is what separates a useful study from a false assurance.
- It models one set of conditions. Real pouring temperature varies ±20–30 °C, sand moisture and compaction drift through a shift, and ladle practice is not perfectly repeatable. A model calibrated at the middle of the window will not predict the edges.
- Hydrogen and binder gas are not in the standard solve. Gas porosity from dissolved hydrogen in aluminium, or from nitrogen in resin binders, needs separate data — a thermal study will not flag it. See common casting defects for the distinction between shrinkage and gas.
- Mechanical properties are inferred, not predicted. Microstructure modules can estimate local hardness or dendrite arm spacing, but yield and elongation still come from test coupons and Wärmebehandlung.
- Boundary conditions need calibration. Two or three thermocouple cooling curves from a real casting are what turn a generic HTC library into a model that matches that foundry.
- First-article inspection is still mandatory. The study reduces trials from three or four to one; it does not remove the first one.
Used that way, casting simulation is a tooling-risk tool, not a quality certificate. It sits alongside mold and pattern design rules and alloy selection — see how to choose a casting alloy — as one of the three decisions that determine whether the first sample is good. For a survey of where each process sits, start with the metal casting guide.
FAQ
How long does a casting simulation take?
Two to five working days for a typical single-cavity part: meshing and cleanup take most of it, the solve runs 2–12 hours. A thin-wall model at 15–20 million cells can run 24–30 hours, so plan a week.
What does a study cost?
$600 to $2,500 per part depending on mesh size and number of cavities. Many foundries absorb the cost when it is attached to a tooling order, because it protects their own pattern investment.
Can simulation replace a trial pour?
No. It reduces trials from three or four to one. The first article still needs sectioning, radiography or pressure testing against the agreed acceptance criteria, and its cooling curves are what calibrate the next model.
Which alloys benefit most?
Carbon and low-alloy steel first — high shrinkage, expensive machining, and scrap is costly. Then heavy-section ductile iron and large aluminium structural parts. Thin-wall zinc and small aluminium Druckgussteile benefit less, because the tooling is cheaper to change and the cycle is dominated by die thermal balance rather than feeding.
Does casting simulation work for investment casting and die casting?
Yes, with different inputs. Investment casting adds shell preheat (typically 800–1,000 °C) and a much slower cooling rate; die casting fills in 30–100 ms and needs the die thermal balance over many cycles, not one shot. Both are routine in current software — the difference is in the boundary conditions, not the solver.
*Data referenced from AFS / NADCA industry publications and Supro MFG shop-floor records.
 English
 Français
 Deutsch
 Italiano
 日本語
日本語 한국어
한국어 Polski
 Português de Angola
 Русский
 Español de Argentina