
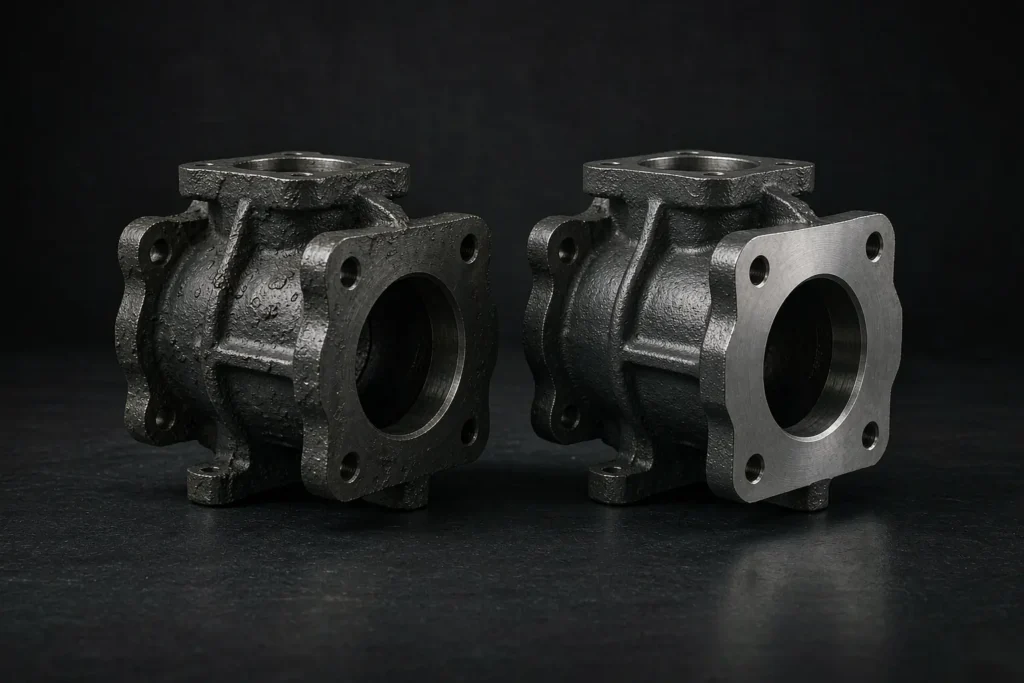
Casting total cost of ownership is the number that decides whether a cheap quote was actually cheap. Two foundries bid the same 18 kg ductile iron pump housing: one asks $41.80 FOB, the other $46.20. On the spreadsheet that goes to management, the first one wins by 10.5%. On the shop floor, the second one costs $4.88 less per finished part — because the price gap lives in the machining hours, the scrap rate and the container schedule, not in the casting.
This article builds a casting total cost of ownership model you can run in one afternoon: eleven line items, where to get each number, and two worked examples with real arithmetic. One example shows a premium quote winning on total cost; the second shows a cheap quote winning — because total cost of ownership is not an argument for spending more, it is an argument for pricing the risks you actually carry. Methods follow the cost-structure practice published by the American Foundry Society (AFS) and the process-capability guidance used by NADCA.
Why Unit Price Is the Wrong Decision Variable
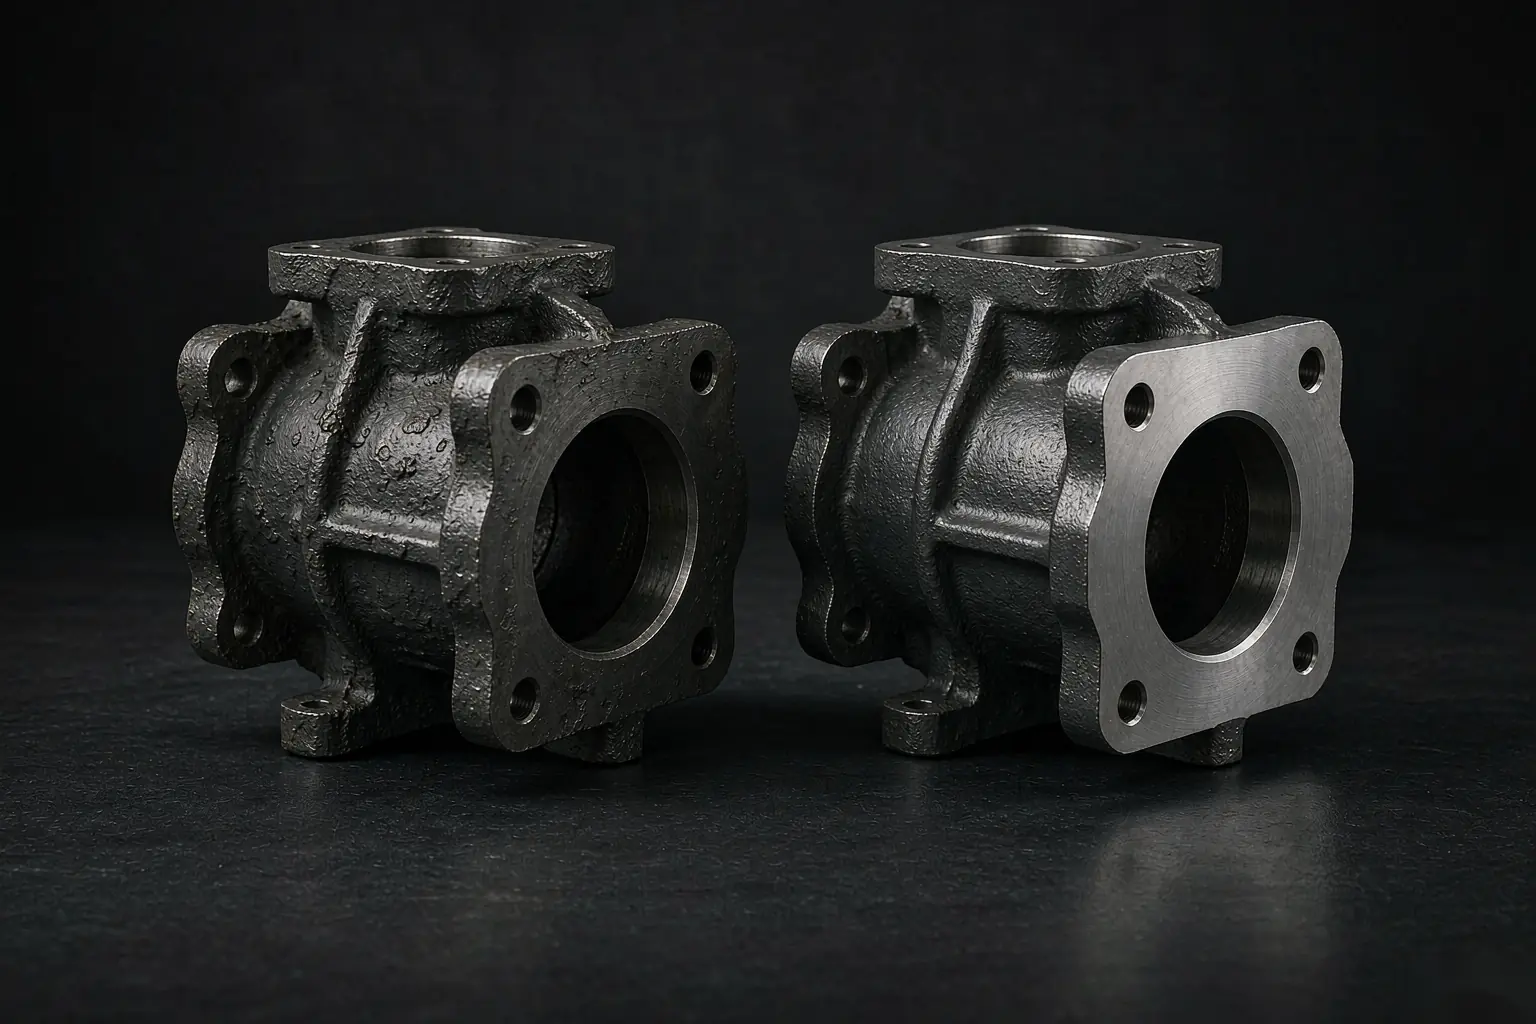
A quoted FOB price covers one thing: a casting at the factory gate. Everything that happens after that gate — freight, duty, receiving inspection, machining, rework, warranty, the cash you have parked in stock — is paid by the buyer and never appears in the comparison. On a machined, pressure-containing casting those downstream costs routinely run 1.6 to 2.2 times the FOB price, so a 10% price difference can be cancelled by a 5% difference in any single downstream line.
The trap is structural. Purchasing is measured on purchase price variance. Machining, quality and logistics sit in other cost centres, so the consequences of a low quote land in someone else’s budget. A casting total cost of ownership model simply moves those consequences back onto the same line as the price.
It also changes the conversation with the foundry. Once you ask for the four numbers that drive the downstream lines — dimensional capability, expected scrap, machining stock and shipment frequency — you are no longer comparing prices, you are comparing processes — and in practice, casting total cost of ownership turns a price comparison into a process comparison. That is the same discipline we describe in how to qualify a foundry before you award.
The Eleven Lines of a Casting Total Cost of Ownership Model
A casting total cost of ownership model needs eleven lines to be honest and few enough to actually fill in. Each line has a source document: if you cannot find the number, ask for it in the casting RFQ before you award, not after the first shipment.
| # | Cost line | Where the number comes from |
|---|---|---|
| 1 | FOB / EXW unit price | Quotation, with validity date |
| 2 | Tooling amortisation | Tooling quote ÷ committed volume over the contract |
| 3 | Ocean + inland freight | Forwarder, per kg at the planned shipment size |
| 4 | Duty, Section 232 and port fees | HS classification + declared metal content |
| 5 | Scrap replacement castings | Foundry’s own 12-month scrap rate for the part family |
| 6 | Machining to finished size | Cycle time × machine hour rate |
| 7 | Machining hours lost on scrap | Defect rate found after roughing × 60% of cycle time |
| 8 | Inventory carrying | Average stock × landed value × 22%/yr |
| 9 | Price-adjustment exposure | Index clause × expected index move |
| 10 | Incoming inspection and containment | Sampling plan × labour hours × $55/h |
| 11 | Payment-terms capital cost | Cash outstanding × months ÷ 12 × 8%/yr |
Lines 1 to 4 are the landed casting. Line 5 converts scrap into extra castings you must buy. Lines 6 to 11 are the downstream costs that differ between suppliers. Basis for every line: one good machined part delivered, all costs divided by good parts out.
Line 4 deserves its own warning
For steel and aluminium articles entering the US, the duty stack is not one number. A ductile iron housing classified in Chapter 73 takes MFN plus the Section 232 charge on the full customs value; the same housing classified as a pump part outside Chapter 73 is charged 232 only on its declared metal content. On a $41.80 casting with 62% declared metal content, that is the difference between roughly $21.30 and $14.37 per piece. The classification work is described in casting import duty and HS codes, and it belongs in the model before you compare quotes, because the two suppliers may file under different headings. Get it wrong and your casting total cost of ownership figure moves by about $7 a part before a single chip is cut.
Worked Example A: The Premium Quote Wins
Part: ductile iron pump housing, 18.0 kg net, sand cast, pressure boundary, 2,400 pieces a year on a three-year contract (7,200 pieces). Supplier A quotes $41.80 FOB on a wood pattern. Supplier B quotes $46.20 FOB on an aluminium pattern with machined core boxes. Both quote the same ASTM A536 65-45-12 material. Here is what casting total cost of ownership does with those two numbers.
| Cost line | Supplier A | Supplier B |
|---|---|---|
| 1. FOB unit price | $41.80 | $46.20 |
| 2. Tooling over 7,200 pcs ($4,800 wood / $11,500 aluminium) | $0.67 | $1.60 |
| 3. Freight ($0.14/kg vs $0.16/kg, 18 kg) | $2.52 | $2.88 |
| 4. Duty, 232, MPF/HMF (34.4% of FOB) | $14.37 | $15.88 |
| 5. Scrap replacement (4.0% vs 0.9% total scrap) | $2.47 | $0.60 |
| 6. Machining (14.2 min vs 9.6 min at $78/h) | $18.46 | $12.48 |
| 7. Machining lost on scrap (1.4% vs 0.2% found after roughing) | $0.16 | $0.01 |
| 8. Inventory carrying (2 vs 6 shipments/yr) | $3.23 | $1.19 |
| 9. Price-adjustment exposure (index +9%) | $1.35 | $0.17 |
| 10. Incoming inspection (5% layout vs 2% dock-to-stock) | $1.28 | $0.58 |
| 11. Payment capital (50/50 vs 30/70 at 8%/yr) | $0.32 | $0.16 |
| Total per good machined part | $86.63 | $81.75 |
Supplier B’s FOB price is 10.5% higher and its total cost is 5.6% lower — $4.88 per part, $11,712 a year. Read the table top to bottom and you have the whole argument for casting total cost of ownership: the cheapest casting is not the cheapest part. Put the other way round, Supplier A is $7.20 ahead on the four price lines and $12.08 behind on the seven downstream lines. Three lines do almost all the work, and none of them is the casting price:
- Machining, $5.98 of the gap. Supplier A’s process holds a looser dimensional grade, so the foundry and the buyer agree on more stock. At 14.2 min versus 9.6 min on a $78/h machining centre that is $18.46 against $12.48. The extra stock is not waste — it is the price of a wider tolerance band, and it is worth reading alongside how much stock to leave, process by process and the tolerance grades in the ISO 8062 buyer’s reference.
- Scrap, $1.87 of the gap. A 4.0% total scrap rate means Supplier A must ship 4.2% more castings to deliver the same number of good parts. The foundry absorbs its own internal scrap; you absorb every piece that dies after it is poured and paid for.
- Inventory, $2.04 of the gap. Two shipments a year means an average of 600 castings sitting in your warehouse. Six shipments a year means 200. At 22% carrying cost — 10% capital, 6% obsolescence and risk, 4% warehousing, 2% insurance and handling — that is $7,747 against $2,858 a year.
The arithmetic behind the two lines people argue about
Duty on Supplier A’s $41.80: MFN 2.9% = $1.21, Section 232 at 50% on 62% declared metal content = $12.96, MPF 0.3464% = $0.14, HMF 0.125% = $0.05. Total $14.37, or 34.4% of the FOB price — not the 2.9% most buyers budget for.
Inventory carrying on Supplier A: 600 pieces average × $58.69 landed = $35,214 tied up, × 22% = $7,747 a year, ÷ 2,400 pieces = $3.23 per part. The same calculation is what makes minimum order quantities expensive long after the discount is forgotten: a 6% quantity break that doubles your average stock is usually a net loss.
Worked Example B: The Cheap Quote Wins
A casting total cost of ownership model is not a licence to buy the expensive option. Change the part and the answer flips.
Part: grey iron counterweight, 6.5 kg, 900 pieces a year, no machining, no pressure boundary, no fatigue load — it bolts on and sits there. Supplier A quotes $9.40 FOB with a 3.8% receiving scrap rate; Supplier B quotes $11.20 with 1.2%.
- Supplier B’s premium, landed: $1.80 × 1.344 (duty stack) = $2.42 a piece, $2,177 a year.
- Supplier A’s extra scrap: (3.8% − 1.2%) × 900 = 23.4 pieces × $13.54 landed = $317 a year.
- Supplier A’s extra sorting: 0.02 h visual check per piece × 900 × $55/h = $990 a year.
Supplier A’s disadvantages total $1,307 a year against B’s $2,177 premium, so the cheap quote wins by $870 a year. More useful is the break-even: A’s receiving scrap would have to reach 10.9% before B’s premium pays for itself. Below that, buying the better process is buying insurance you will not claim.
The rule that falls out of both examples is simple. Casting total cost of ownership follows the consequences, not the part price. When a defect is cheap to absorb — no machining behind it, a buffer in front of it, no safety function — buy on price. When a defect is expensive to absorb, buy on capability. The escalation is brutal and predictable: a housing that costs $58.69 landed costs about $69.76 if the defect surfaces during rough machining, $83.34 if it surfaces at final test, roughly $266 if it stops a customer’s assembly line, and about $1,850 once it is a field warranty claim. That is why acceptance criteria and defect claims belong in the commercial file, not only in the quality file.
Which Lever Dominates, by Part Type
Do not build all eleven lines to full precision for every part. A casting total cost of ownership estimate only needs two or three lines to be exact; the rest can be budget-level. Most of the answer comes from two or three. Use this to decide where to spend your estimating time.
| Part type | Dominant TCO levers | What to demand in the quote |
|---|---|---|
| Pressure-containing, machined (pump, valve, compressor) | Machining stock, defect escape rate, pressure-test coverage | Dimensional grade, stock per face, leak-test method and rate |
| Structural, welded or bolted into a frame | Tooling amortisation, yield, delivery batch size | Tooling life in shots or moulds, shipment frequency options |
| Wear parts (liners, shoes, crusher parts) | Material grade, heat treatment, service life | ASTM grade, hardness range, tratamiento térmico chart |
| Visible / cosmetic housings | Surface scrap rate, finishing operations, packaging | Surface acceptance sample, finishing route, packaging spec |
| Prototype and pre-production | Tooling strategy, iteration speed, sample lead time | Soft tooling option, sample lead time, measurement report |
Process route moves the same lines again. A housing quoted as an fundición a la cera perdida carries a tighter tolerance band and higher tooling; the same geometry as a fundición a presión trades wall thickness for cycle rate; an aluminium conversion cuts freight and duty while raising alloy cost. All three shift lines 2, 5 and 6 at once, so re-quote on a second route before you conclude that a supplier is expensive.
One lever never appears in a quotation: how many hands the part passes through. Every extra supplier adds a freight leg, a receiving inspection and a layer of claim ambiguity. Consolidating Mecanizado CNC, tratamiento térmico y surface treatment with the foundry removes all three — exactly the kind of cost a casting total cost of ownership model is built to expose, and the same trade-off priced out in casting secondary operations.
Five Numbers to Ask For Before You Compare Quotes
You cannot fill lines 5, 6, 8 and 10 from a price sheet. Ask for these in the first round and the whole casting total cost of ownership model becomes mechanical:
- Dimensional capability on the two critical features. A Cpk or a 30-piece capability study beats any tolerance claim on paper. The first article inspection report is where you get it before volume starts.
- The foundry’s own 12-month scrap rate for the part family. Not the contractual defect rate — the actual one. It sets line 5 directly.
- Machining stock per critical face, in millimetres. This is the single largest hidden lever on any machined casting. Convert it into spindle minutes before you compare.
- Shipment frequency options and their freight rates. Ask for two- and six-shipment pricing; the difference is line 8.
- The index clause and its dead band. A pass-through with no dead band transfers 100% of the noise to you. The mechanics are set out in how price adjustment clauses work, and they pair with the cash impact described in casting payment terms.
Two more that sit just outside the eleven lines but belong in the decision: what happens to tooling at the end of the contract — ownership, storage and refurbishment responsibility, covered in casting tooling cost, pattern and core box manufacture y tooling maintenance — and how stable the process is over three years, which is what foundry automation actually buys you.
How to Present It So It Gets Approved
Most casting total cost of ownership models fail in practice for an unglamorous reason: the savings land in departments that did not ask for the analysis. Three things fix that.
- Show the delta, not the total. “$86.63 versus $81.75 per part” is an argument. “$4.88 per part, $11,712 a year, and 61% of it is machining hours” is a decision.
- Name the owner of each line. Machining signs off line 6, quality signs off lines 5 and 10, logistics signs off 3 and 8, finance signs off 11. A number with an owner stops being an opinion.
- Commit the volume the model assumes. Tooling amortisation and freight are only valid at the quantity you used. If the contract volume drops 30%, lines 2 and 3 move and the ranking can flip — which is exactly the question the shop-floor cost breakdown answers from the other side of the table.
If you only have one day, build a four-line casting total cost of ownership estimate: lines 1, 4, 5 and 6. Those four decide most machined-casting awards, and all four are obtainable from the quotation plus one phone call. Everything else refines the margin, it rarely reverses it.
Preguntas frecuentes
What is casting total cost of ownership in one sentence?
Casting total cost of ownership is every cost a buyer incurs from the quotation to the finished part — price, tooling, freight, duty, scrap, machining, inventory, cash and quality risk — divided by the number of good parts delivered.
How much does the unit price usually matter?
Less than people expect on machined parts. In casting total cost of ownership terms, FOB is 48% of the $86.63 total; machining is 21%, duty 17%. On an unmachined part, FOB is typically 70–80% of total and the cheap quote is usually right.
Does casting total cost of ownership always favour the expensive supplier?
No. In the counterweight example the $9.40 quote beat the $11.20 one by $870 a year, and it would keep winning until receiving scrap passed 10.9%. The model only favours the premium supplier when the consequences of a defect are expensive to absorb.
Which single number should I ask a foundry for first?
Machining stock on the critical faces, in millimetres. It converts directly into spindle hours and it is the largest hidden lever on any machined casting.
Should duty really be 34% and not the MFN rate?
For steel and aluminium articles it can be. MFN alone may be 2.9%, but Section 232, MPF and HMF stack on top — in the example, $14.37 on a $41.80 casting. Confirm the classification and the declared metal content before you model it.
What carrying cost percentage should I use for inventory?
22% a year is a defensible default for industrial hardware: 10% capital, 6% obsolescence and engineering-change risk, 4% warehousing, 2% insurance and handling. Use your own finance number if you have one; the ranking rarely changes below 18% or above 28%.
*Cost structure and capability practice referenced from AFS and NADCA publications; duty stack and arithmetic based on Supro MFG quotation records. Figures are illustrative — substitute your own rates, volumes and classification.
 English
 Français
 Deutsch
 Italiano
 日本語
 한국어
 Polski
 Português de Angola
 Русский
 Español de Argentina